PPML Summer School: Python Overview

The purpose of this notebook is to help you setup the environment for python data analysis, so that you can start the course smoothly. After installing the python and extra packages, try running the codes in this notebook on your system.

Installing Python

For this course we will frequently use the following python "packages".

While you can download and install each package from PyPI using PIP, I recommend you to install the Anaconda python distribution, which comes with some popular third party packages (e.g., numpy, scipy, and sklearn). Also, all the code examples and lectures will assume you have installed the Anaconda.

Installing Anaconda

Installing anaconda can be done with just a few clicks.

  1. Visit this page and read the instructions.
  2. Download the correct installer for your OS and architecture.
    • Window/Linux/OS X
    • 32bit VS 64bit
  3. Make sure that you download the Python 3.8 version.
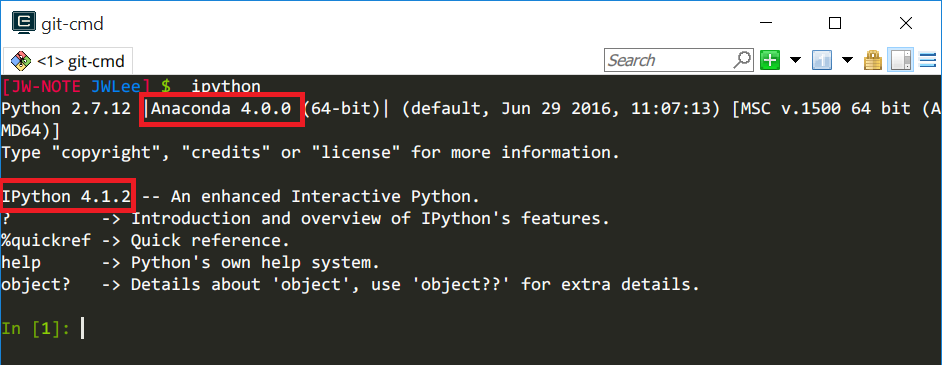
  4. After the installation is done, test it by running the ipython.
    ipython
    You should see something like this:

(Optional) If you already have installed Python or Anaconda

If you've been using Anaconda, then you just need to update the packages to their latest version.

conda update conda
conda update anaconda

If you have python installed on your system and don't want to install anaconda, you can try installing each package using the PIP, a python package installer. If you want to find more about pip, see this page. First, you need to update the pip to the latest version.

pip install --upgrade pip

Once it is done, try installing the following packages:

pip install numpy 
pip install scipy
pip install matplotlib
pip installl sklearn

Jupyter Notebook

Notebook mode

Jupyter notebook has two different mode: command mode and edit mode.

Keyboard shortcuts

When you are in command mode,

When you are in edit mode,

Now let's check the version of installed packages.

Q1. Report the versions of packages on your system (5 pts).

Run the following code on your system.

Basics of Python

Hello World

Let's start by introducing how to print out strings in python. To print strings or to see the value stored in a variable, you can use print function. Type the following code in a (code) cell and press shift + enter.

Basic Data Types and Operations

Python maintains any data you provide as a python object. Based on what you provided, python will automatically determine what objects are used to store them. In python, you don't have to explicitly specify data type when declaring a variable; they are dynamically typed. See the following example, both variables stores the value of 2 but they are stored in different format. One is stored as an integer while the other is as a floating point number.

You can also explicitly change one object into the other; this is called type casting. If you want $x$ to be stored as a real number (i.e., float type), you can do so as follows:

Here is a list of python objects we will be mainly using in this course.

Booleans

Python provides usual boolean operators such as 'logical and', 'logical or", and 'logical not'. See the following example:

Strings

The python string is regarded as a sequence of characters. To declare a string, just enclose the string with either double or single quotation marks. Since they are just list of characters, you can do

To get a better idea, let's see the following examples.

Containers

Python has various built-in containers and a set of functions to manipulate them.

List

The first container type we will look at is the list. A list is a mutable collection of object, which means that it's resizable and can contain different types. To find a complete list of available functions on a list, refer to this document.

Slicing: in addition to indexing, python provides an easy way of obtaining a subset of elements, which is called slicing. The syntax for slicing is list[start:end:stride]. Note that the start index is included while the end is not included. This will become clear once you see the following examples.

Q2. reverse a string using the list slicing (5 pts).

In python, you can view a string as a list of characters. For example, str="hello" is a list with 5 elements. As you can expect, str[0] == 'h', str[1] == 'e', and so on. Print a reversed string of "hello" using the list slicing. In other words, your output must be "olleh".

Looping over a list: When programming in python, we often need to iterate lists (with an index). If you need to access each element with their index,use the built-in enumerate() function.

Dictionaries

A dictionary is useful if you need to store and access the data using key-value pairs. This is a python equivalent of Map in Java.

Adding and modifying: A new key-value pair will be added if there's no item with the same key. If the key exists, it modifies the existing value.

Looping: you iterate the dictionary using a simple for ...in statement.

Sets

A list is useful when storing a sequence of heterogeneous objects, but it allows duplicates. Suppose you want to count the number of disticnt words in a movie review dataset. You can use the list for doing this but need to check if the list already contains the word whenever you insert into the list. A set in python is a mutable, unordered, and unique collection of objects. It is designed to reflect the properties of a mathematical set. For more information, see here.

Creation: you can create an empty set using the built-in set() function. Optionally, you can provide an iterable object as an argument to create the set from the elements of existing container.

Set operations: The set() container comes especially handy when you need to deal with set operations, such as union, intersection, and so on.

Functions

To define a function in python, you can use def keyword. As an example, let's define fibonacci() function that generates the fibonacci sequence of length n. By definition, the Fibonacci sequence is given by $$ F_n = \begin{cases} 0 & \mbox{ if $n=0$} \\ 1 & \mbox{ if $n=1$} \\ F_{n-1} + F_{n-2} & \mbox{ if $n > 1$.} \end{cases} $$

Be careful with indentation!

Leading spaces and tabs in python are used to determine the indentation depth, which in turn is used to determine the scope (or grouping) of statements.

Numpy

Numpy is the fundamental package designed for high performance scientific computing and data analysis. It provides:

Array

Numpy array is an efficient container for large datasets in python that contains homogeneous data, which means all the elments must be of the same type.

Creation: There are two ways to create ndarray object: create an empty array or create it from an existing array.

Slicing: you can apply the slicing on a numpy array using a similar sytax to that of python's list.

Boolean indexing: Suppose you want to select the entries satisfying a certain condition. If you express any arithmetic operations on numpy array, they are vectorized, meaning that each operation is propagated to each element. In the following example, the comparison operation is expressed between an array and a scalar. This operation is propagated to each element, and the result will be vectorized.

If you want to create an array having the same shape with an existing array, you can use ones_like(), zeros_like(), empty_like().

So far, we didn't specify data types when creating an array. By default, numpy will try to infer the type from the element, but it's safer to specify the type explicitly.

Q3. Explain why the commented line of code in the above cell causes an error (5pts).

(hint: the line a = a / 2 sequentially performs division and assignment but a /= 2 doesn't)

Broadcasting

Broadcating in numpy allows you to perform arithmetic operations on arrays efficiently. By default, operations between two numpy arrays are element-wise. For illustration, let's define two arrays.

Often, we want to perform an operation between a vector and matrix (i.e., between two arrays with different shapes). Let's take an example.

To understand the above result, you need to understand how broadcasting in python works. When performing an operation on two numpy arrays, python first inspect the shape of each array. In our example,

The python will notice that one is a 2D array while the other is a 1D array.

  1. The numpy tries to pad the one with smaller dimensionality with 1 from the left side. In other words, numpy will change the shape of Y to (1, 3).
  2. Then numpy will try to match the shape of two arrays by inspecting the size of each dimension.
    • For the first dimension, the size of X is 2 while that of Y is 1. If the size of one array is 1, it tries to stretch to match the other array's size. In our example, Y's first dimension is stretched to the size of 2 to match that of X by replicating elements vertically. In other words, Y becomes $$ Y = \begin{bmatrix} -1 & 0 & 1 \\ -1 & 0 & 1 \end{bmatrix}. $$
    • For the second dimension, the size of both arrays is 3. So, numpy performs the element-wise addition between the following two arrays. $$ X + Y = \begin{bmatrix} 1 & 2 & 3 \\ 4 & 5 & 6 \end{bmatrix} + \begin{bmatrix} -1 & 0 & 1 \end{bmatrix} \Rightarrow \begin{bmatrix} 1 & 2 & 3 \\ 4 & 5 & 6 \end{bmatrix} + \begin{bmatrix} -1 & 0 & 1 \\ -1 & 0 & 1 \end{bmatrix} $$

Let's look at another example.

We know the shapes of X and Y are (2, 3) and (2,), respectively. Since their dimensionality doesn't match, it will pad Y to have the shape (1, 2). Let's compare their sizes dimension by dimension. The sizes of first dimension do not match: 2 and 1, but numpy will try to stretch the size of Y to 2 to match the X's size. For the second dimension, we have a mismatch again: 3 VS 2. However, neither X nor Y has the size 1, so numpy will throw an error as there's no way it can match the sizes of two arrays. See the error message below!

Why using numpy arrays: ndarray is memory efficient and provides fast numerical operations. The following examples just create a sequence $\{x^2: i=1, 2, \ldots, 1000\}$.

Saving and Loading Text Files

A frequent task you will be doing throught the semester is to load data from text files. pandas package provides read_csv() and read_table() functions for easy loading of data from files. Numpy also provides np.loadtxt() function to load data directly into numpy array.

Random Number Generation

To generate random numbers, you can use numpy.random module. Here is a list of functions provided by the module (as always, refer to the python documentation for more details).

Function Description
np.random.randn() draw samples from a standard normal
np.random.rand() draw samples from a uniform distribution
np.random.binomial() draw samples from a binomial distribution
np.random.uniform() draw samples from a uniform[0,1) distribution
np.random.gamma() draw samples from a gamma distribution
np.random.shuffle() randomly permute a sequence in place
np.random.choice() generate a random sample from an array

Our first plot

To check if the matplotlib is correctly installed, we will draw 10,000 random samples from the Gaussian distribution with mean 0 and standard deviation 1, i.e., standard normal distribution, and draw a histogram. If you are not sure what the following code is doing, don't worry; we will comeback to this again. You may want to play with this plot by changing the value of nsamples and nbins.

Q3. Write a function that simulates a (biased) coin flip (10 pts).

A biased coin flip can be modeled as a random variable that follows Bernoulli distribution. Let $X$ be a random varaible that takes the value of 1 if the coin flip ends with "head" and 0 otherwise. Mathematically, this can be written as $X \sim \mathsf{Bernoulli}(p)$, meaning $$ X = \begin{cases} 1 & \mbox{ with probability $p$} \\ 0 & \mbox{ with probability $1-p$.} \end{cases} $$

What did we do?

Our population (coin flips) is modeled by a Bernoulli random variable with the unknown parameter $p$, the probability of head. To estimate the the parameter $p$, we collected a random sample of size $n=10$ and estimated $p$ by simply counting number of heads and dividing it by $n$ (to make a probability). Is our estimate for $p$ close enough to the true value of 0.3? With $n=10$, probably our estimate is very inaccurate. Let's see what happens as we increase the sample size $n$.

Try executing this cell a few times! What do you observe?

It is known that the sum of $n$ independent Bernoulli random variables follows a Binomial distribution. Formally, $$ \begin{equation} Y = X_1 + X_2 + \cdots + X_n \sim \mathsf{Binomial}(n, p)\,, \end{equation} $$ where $X_i \sim \mathsf{Bernoulli}(p)$ for $i=1, \ldots, n$.

Q4. Simulate n coin flips t times and draw a histogram (5 pts).

The n_coin_flips() function below returns a number of heads in $n$ coin flips, which follows a binomial distribution. That is, n_head$\sim \mathsf{Binomial}(n, p)$. To generate a sample of size $t$, run the n_coin_flips() function $t$ times and build a histogram on the sample. You can use plt.hist() to draw a histogram. For input parameters and outputs, see here.

Here's the test code for your implemenation of n_coin_flips() function.

Timeit

When you are writing a program, you may wonder how fast or slow a particular piece of code is. %timeit is a function for doing this. The following code shows 3 different ways to calculate the sum of squares of numbers in a list. $$ SS = \sum_{i=1}^n x[i]^2 $$