
Assignment/Project 3: Detecting Fraud using Benford's Law
| Assignment Day | Wednesday: September 12, 2013 (assignment will updated until Assignment date, after that there will only be clarification updates) |
| Due Date (Data) | Friday: September 21 before class (hardcopy and email) |
| Format | Email to TA see home page for address and cc Instructor You will also need to hand in a Hardcopy of your Data Sheets |
In this assignment you will explore different data sets, and analyze or determine whether they adhere to Benford's law (or not).
Wikipedia Describes Benford's Law here:
http://en.wikipedia.org/wiki/Benford's_law
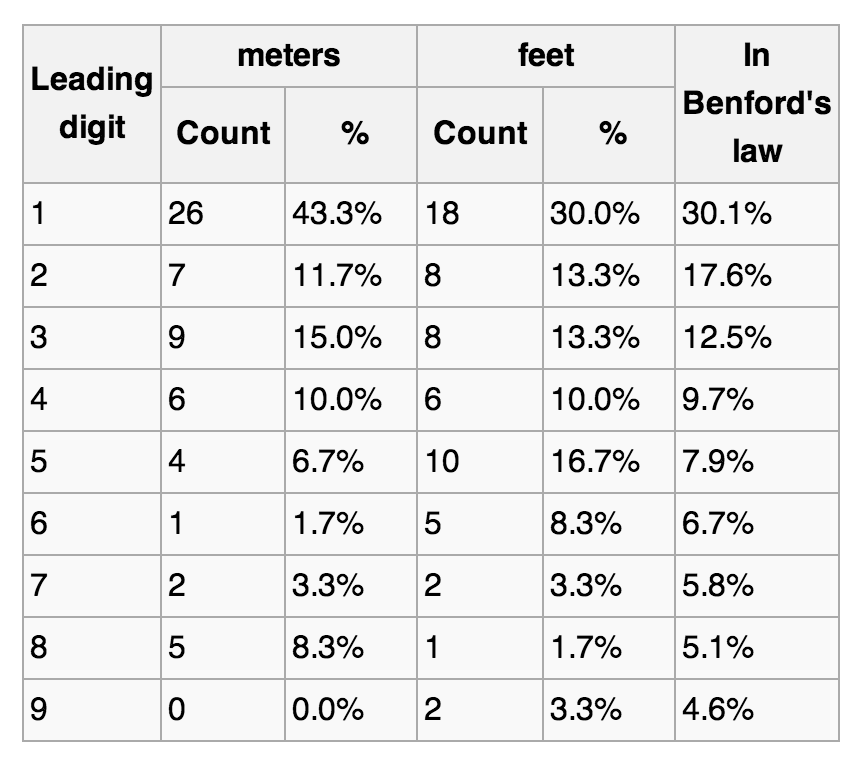
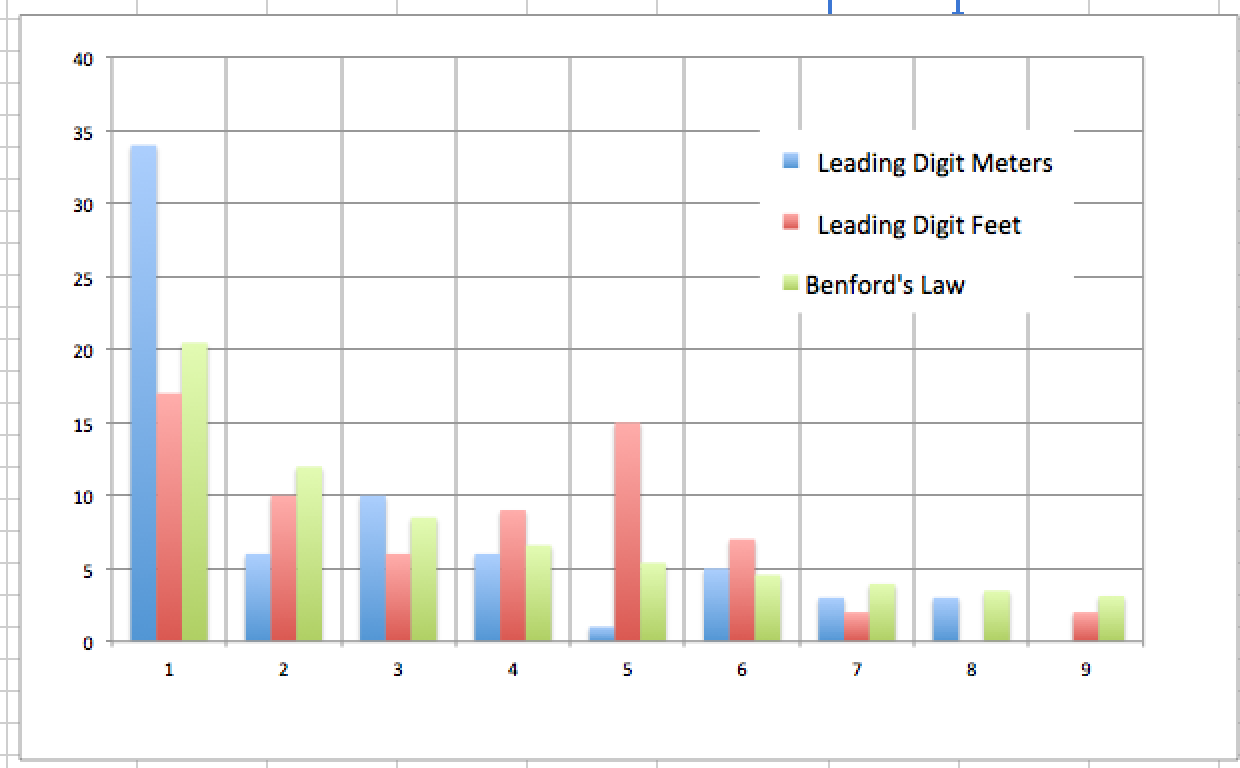
a) You will need to reproduce the Wikipedia table below (and an additional column) and its histogram. The data should be collected (imported) from the URL:
http://en.wikipedia.org/wiki/List_of_tallest_buildings_and_structures_in_the_world. Note: the result may not be the same, as Wikipedia may have used data from a different date frame).
The table lists the leading digits of heights of buildings both in feet and meters.
Requirements:
I) The "In Benford's Law" Column needs to be the Benford's formula: =LOG10(1 + 1/d). See Wikipedia for more details on this formula).
II) You will need to add a column that shows the number of buildings according to the ideal (as shown in class).
III) You will need to combine the tables that lists buildings by category, there are 3 such tables.
Snaphots of what we did in class:
Table computing leading digits of meters and feet:
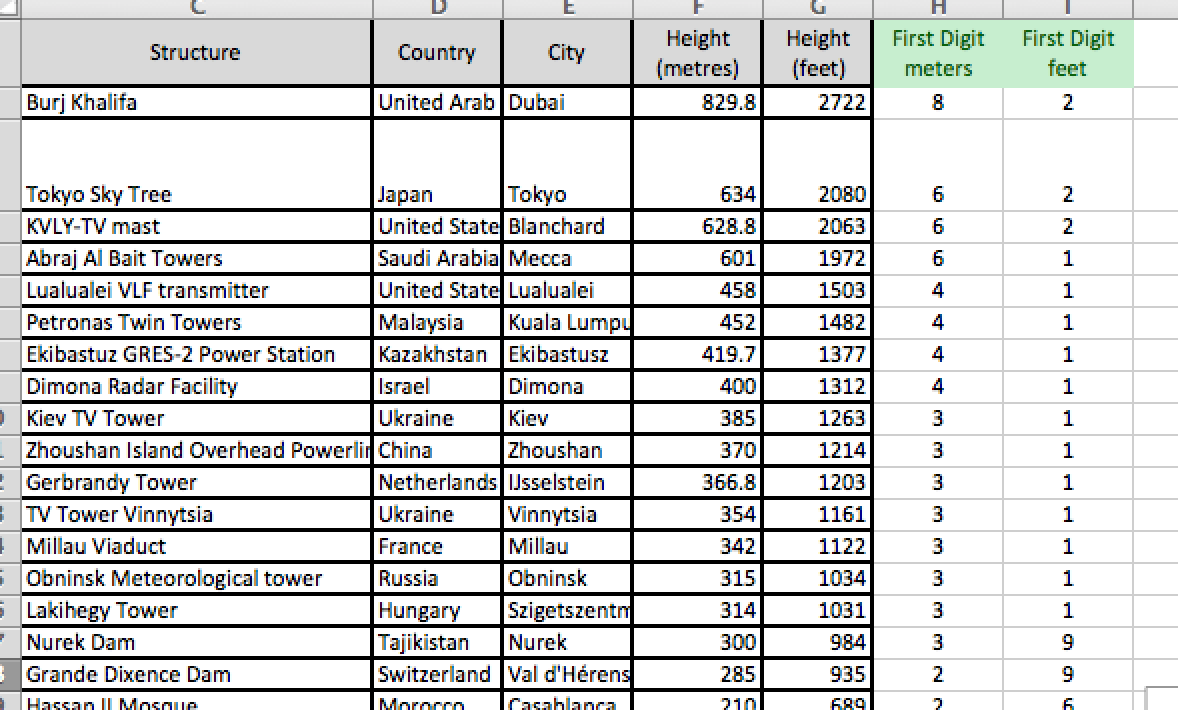
Table listing the "Ideal":
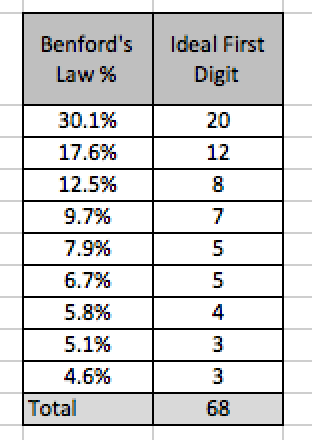
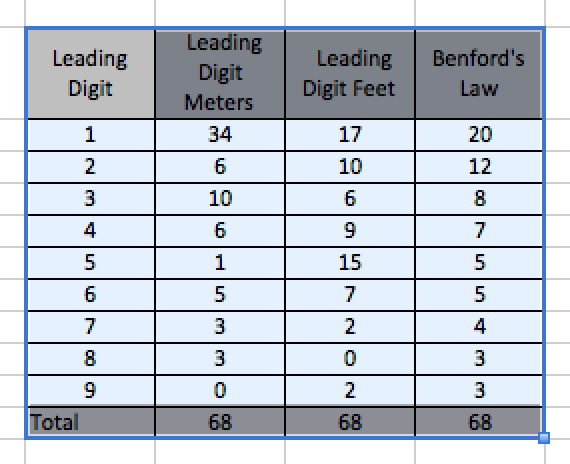
Table Summarizing some of the requirements:
What the histogram may look like:
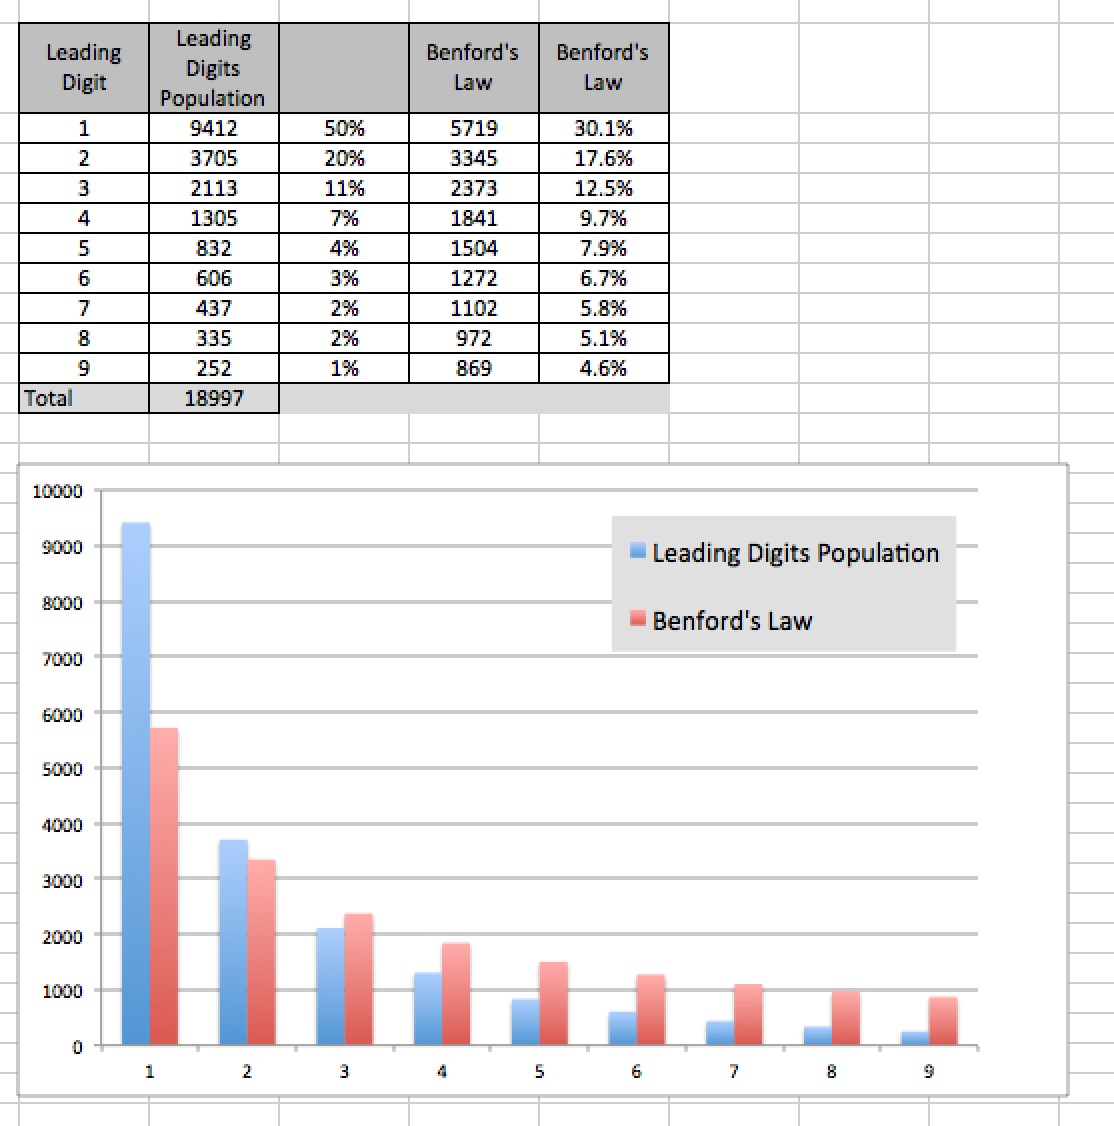
Question 2: Objective: Get Data from an Internet Data Base (not web table), and reproduce result.
Go to this URL: http://testingbenfordslaw.com/population-of-spanish-cities showing the frequency of leading digits of Population of Spanish cities, and reproduce the historgram. Be sure to show the table. (show all work). Below is a snapshot of my progress of this problem:
Question 3: Collect Data
No Question 3.
Question 4: Objective: Analyze the Data
If the data in Q2 or Q3 have non-Bensonesque features (i.e., they are not perfectly Benson-esque) speculate how come?
Helpful resources:
Loading web tables into excel (mac version):
http://www.dummies.com/how-to/content/using-a-web-query-to-load-tables-in-excel-2011-for.html
Loading web tables into excel (windows verion - much easier!):
http://www.howtogeek.com/80142/copy-website-tables-into-excel-2007-spreadsheets-2/
Helpful Excel Functions:
=COUNTIF(), =LEFT(), =LOG10(), =SUM()
Just for fun: More resorces 0n Benford's Law:
http://www.nytimes.com/1998/08/04/science/following-benford-s-law-or-looking-out-for-no-1.html?pagewanted=all&src=pm (Browne's NY Times Article)
Grade 50 points total :
10 points Question 1 (Table & Histogram)
15 points for
question 2 (Table & Histogram)
15 points for question 3 ((Table & Histogram)
10 points for question 4 Analyzing the Data
in Q1-3
Sheet must look clean/neat (not sloppy), nice formatting.