Assignment: Normal Distribution & Frequency Diagrams & Making Predictions
| Assignment Day | Tuesday (evening): November 05, 2013 |
| Due Date: | Friday: November 09 before class (workbook) |
| No late assignment will be accepted. | |
| Format | Email to TA see home page for address and cc Instructor You will also need to hand in a Hardcopy of your Data Sheets |
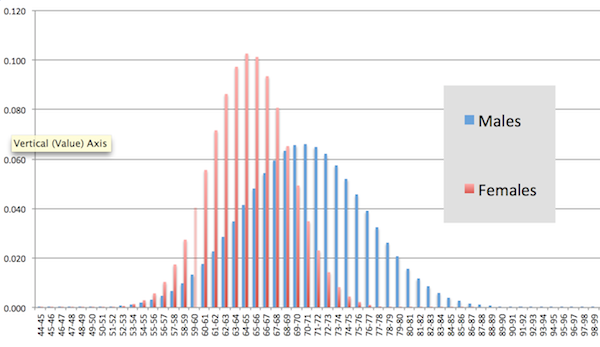
Task 1. From Data Collected in Class, create histograms for heights. One histogram for the height of females, and another for the height of males. Compute the standard deviation, and mean for both populations (male and female). [Create a total of 2 histograms]
Discuss your result, and observations.
Task 2: From google, find out the average height (and standard deviation) of males and females in the US.
{HINT http://www.cdc.gov/nchs/fastats/bodymeas.htm}
Task 3: Plot 4 normal (bell)curves in excel using the result (mean, and standard deviation) from Question 2, and Question 1. (a Total 4 normal curves) . [Create a total of 4 normal 'bell' curves]
{HINT: if you can't find the standard deviation make a guess, starting at 3 inches for men, somewhat smaller for women}
Task 4: Create Historgrams for tbe height of US men an women using the parameteres (standard deviation and mean) from Task 2. To get started, assume that the bin sizes are 2 or 3 inches (you mahy adjust the bin size if you think that improves the result). [Create a total of 2 Histograms using the US population of men and women).
Discuss your result and how it relates or compares to the histogram generated in Task 1.
Task 5: Reflectiing on Tasks 1-4 Discuss weither the class data supports a normal distribution or not? At least 2 paragraphs.
If you wish - you may read or skim these:
http://www.johndcook.com/mixture_distribution.html
http://www.johndcook.com/blog/2008/07/20/why-heights-are-normally-distributed/
http://www.johndcook.com/blog/2008/07/20/why-heights-are-not-normally-distributed/
http://investing.calsci.com/statistics.html
CDC statistics (table with ethnicity group Table 10 & Table 10, bin size of 1 inch - std women = 3.86 inches, men = 6 inches)