Yi Hong
I am interested in theory development and applications to medical as well as to general computer vision problems. Currently, my research focuses on spatiotemporal image and shape analysis, statistical estimation and testing on mainfolds, and atlas-building. In particular, my research interests lie in
Parametric regression on the Grassmannian,
Estimating spatiotemporal changes from image data,
Detecting and locating shape differences between populations,
Statistical testing for longitudinal data,
Statistical atlas with application to upper airway obstruction.
I am also interested in physically-based modeling, simulation and animation in computer graphics. I have worked on physically-based fire simulation.
Parametric Regression on the Grassmannian
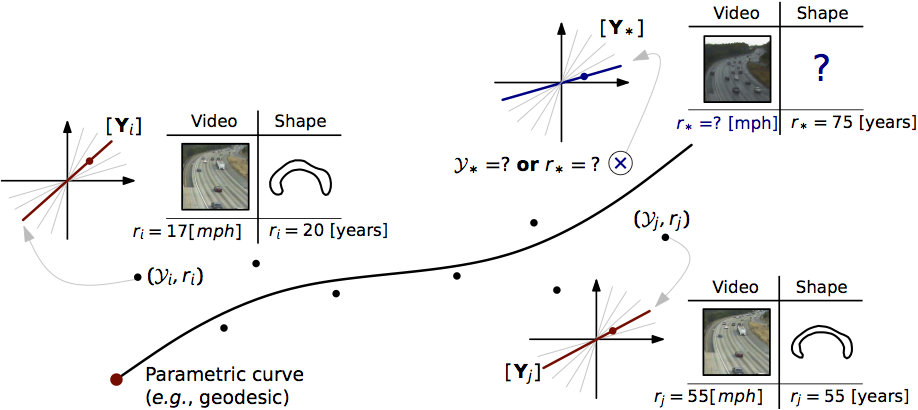 Many data objects in computer vision and medical problems admit a subspace representation. Examples include feature sets obtained after dimensionality reduction via principal component analysis (PCA), observability matrix representations of linear dynamical systems, or landmark-based representations of shapes. Such data objects can be interpreted as points on the Grassmannian G(p,n), the manifold of p-dimensional linear subspaces of Rn. To address the problem of fitting parametric curves on the Grassmannian, we start from the energy minimization formulation by generalizing linear least-squares in Euclidean space, resulting in a geodesic model which is further extended to a “time-warped” variant and cubic splines. This is achieved by using optimal-control, which not only allows to easily generalize regression to manifolds but also to define more complex parametric models on these manifolds.
Take fitting straight lines in Rn for example. Such a line can be defined as an acceleration-free curve and at each time-point it can be represented by two states, its position and velocity. The states at time 0 are referred to the initial conditions. By introducing time-dependent Lagrangian multipliers for each state, we can derive an adjoint system, which is integrated backward to evaluate gradients for updating the initial conditions. This optimal-control perspective constitutes a general method for estimating first-order curves, which allows to generalize the notion of straight lines to manifolds, i.e., geodesics. To increase the flexibility of fitting curves, the idea of time-warped regression is to use a simple model to warp the time-points, or more generally the independent variable, when computing the data matching errors. As a result, a basic geodesic model may be sufficient to fit the data in the warped domain. To further increase the flexibility of a regression model, cubic splines are another commonly used technique. To enable cubic spline regression, we add an external force and represent an acceleration-controlled curve using a dynamic system with three states. Similar to geodesic regression, a shooting solution can be achieved for cubic-spline regression on the Grassmannian via optimal-control.
Now, we have three regression models, i.e., the basic geodesic regression, a time-warped variant, and a cubic-spline version. Which one is suitable for the data? A recent model criticism approach allows us to check if a model fits and if the underlying model assumptions are justified by the observed data. We investigate and extend this approach to evaluate our three regression models on the Grassmannian. In particular, we extend the approach by (1) providing a strategy to generate Gaussian-distributed samples with a specific variance on the underlying manifold, and (2) incorporating existing kernels into the two-sample testing strategy used for model criticism.
Parametric Regression on the Grassmannian
Y. Hong, N. Singh, R. Kwitt, N. Vasconcelos, and M. Niethammer
IEEE Transactions on Pattern Analysis and Machine Intelligence (TPAMI), 2016.Geodesic Regression on the Grassmannian
Y. Hong, R. Kwitt, N. Singh, N. Vasconcelos, and M. Niethammer
European Conferences on Computer Vision (ECCV), 2014.Time-Warped Geodesic Regression
Y. Hong, N. Singh, R. Kwitt, and M. Niethammer
Medical Image Computing and Computer-Assisted Intervention (MICCAI), 2014.Model Criticism for Regression on the Grassmannian
Y. Hong, R. Kwitt, and M. Niethammer
Medical Image Computing and Computer-Assisted Intervention (MICCAI), 2015.
Estimating Spatiotemporal Changes from Image Data
In medical research, image time-series from one subject or a population are collected to study aging, disease progression, and brain development. To capture shape and appearance changes in these spatiotemporal data, regression analysis is popular due to its power of modeling the relationship between data objects and associated descriptive variables, e.g., age. When building regression models for image time-series, one challenge is capturing spatial and intensity changes simultaneously. Such changes occur in MRI studies, e.g., the developing brain due to myelination.
Image metamorphosis aims to jointly account for spatial and intensity changes for two images. It allows exact matching of a target image by an intensity-adjusted image warped from a source image. This is achieved by adding a control variable, which serves as a “source” term and smoothly adjusts image intensities along streamlines. We proposed a shooting solution for image metamorphosis through optimal-control approaches, which is called shooting metamorphosis. It turns out the introduced control variable can be well represented by the state for metamorphosis, i.e., the initial momentum, which is identical to the state for the LDDMM (large displacement diffeomorphic metric mapping) registration.
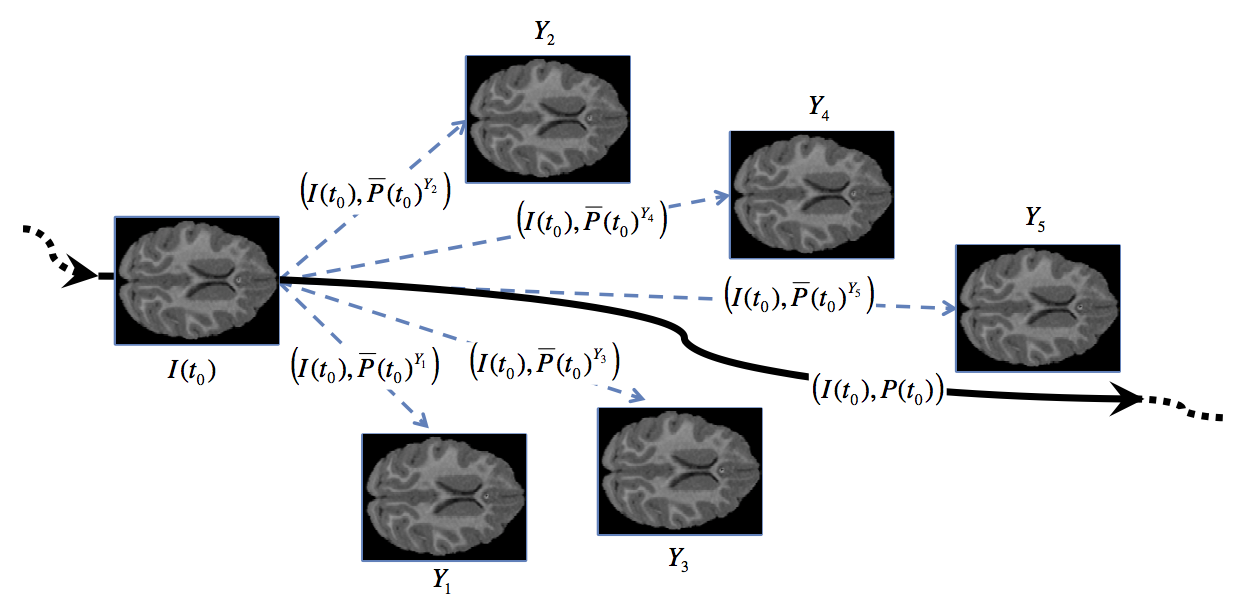 Similar to shooting metamorphosis, a metamorphic regression formulation can be achieved through estimating a regressed geodesic (under the geodesic equations for metamorphosis) which fits a set of images instead of just two images. This is achieved by minimizing the sum of squared geodesic distances between image measurements and their corresponding estimated images on the regressed geodesic, plus a regularity term that controls the smoothness of the regressed curve. To simplify the solution of metamorphic geodesic regression, the distance between two images is approximated with respect to a base image, which results in an approximate solution with an appropriate averaging of the initial momenta of independent pair-wise shooting metamorphosis. This idea enables to jointly and efficiently captures spatial deformations and intensity changes in image time-series.
Metamorphic Geodesic Regression
Y. Hong, S. Joshi, M. Sanchez, M. Styner, and M. Niethammer
Medical Image Computing and Computer-Assisted Intervention (MICCAI), 2012.Simple Geodesic Regression for Image Time-Series
Y. Hong, Y. Shi, M. Styner, M. Sanchez, and M. Niethammer
5th International Workshop on Biomedical Image Registration (WBIR), 2012.
Detecting and Locating Shape Differences Between Populations
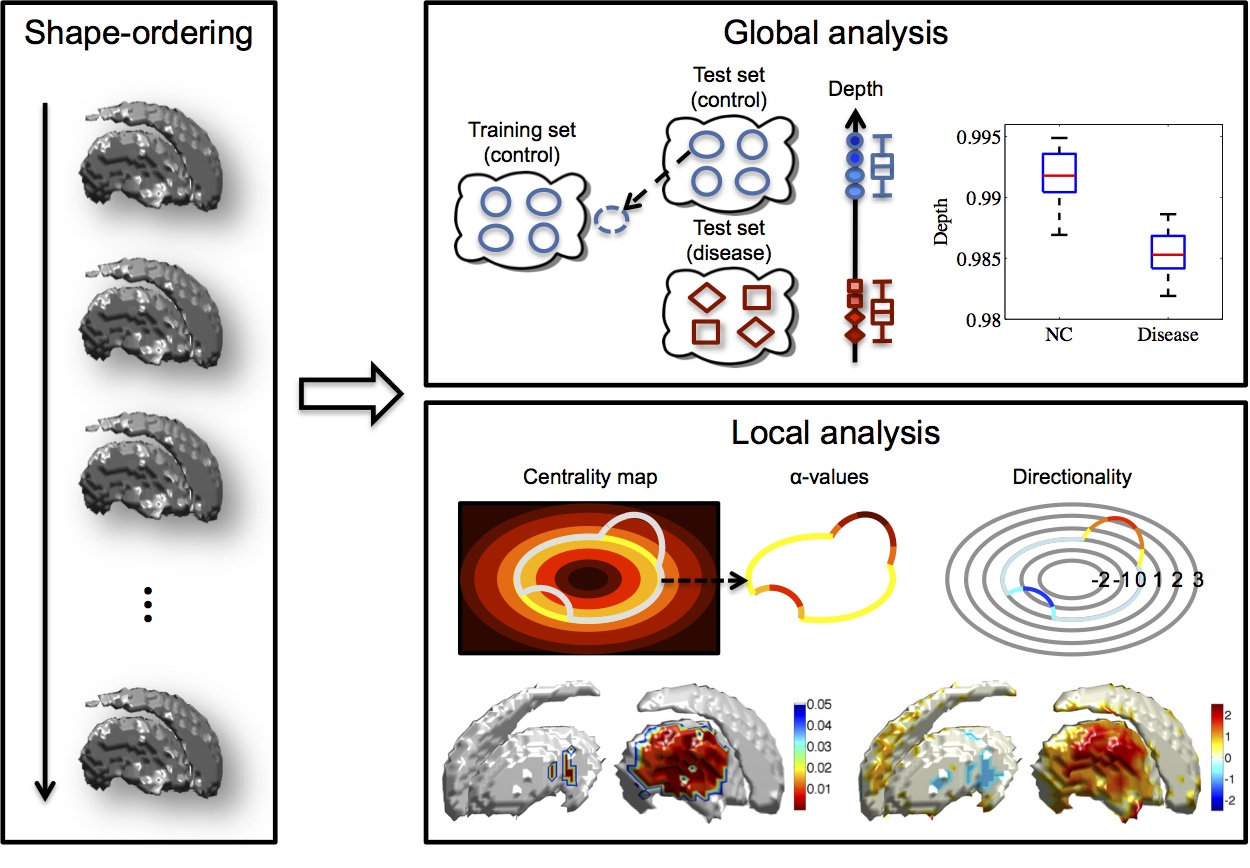 Shape analysis approaches have been proposed to assess object properties beyond global volume and to characterize shape variations across subjects and between subject populations. The methods can be roughly subdivided into two categories: methods for global analysis, i.e., detecting if population shape differences exist, and methods for local analysis, i.e., locating these differences with point-to-point correspondence between shapes. Most existing methods are based on the classical point distribution model (PDM), which assumes a Gaussian distribution of the points around the mean shape. We aim to develop a new approach that is free from strong distributional assumptions, while detecting potential global and local differences between shape populations without an explicit computation of dense correspondences.
To achieve this goal, we propose to perform shape analysis based on the ordering of shapes using band-depth, which non-parametrically defines a global depth for a shape with respect to a population. Based on the depth and the ordering of a shape population, statistical tests are defined to globally separate control and disease groups using global analysis with a scalar value (depth) for each shape. Statistical difference for global analysis results can be established through permutation testing. Equivalently, local shape differences can be detected using local analysis with a corresponding local permutation test, resulting in p-values on the surface of a shape to establish local shape differences between populations. The directionality of the shape differences (inflation versus deflation) can also be determined.
Shape Analysis Based on Depth-Ordering
Y. Hong, Y. Gao, M. Niethammer, and S. Bouix
Medical Image Analysis (MedIA), 2015.Depth-Based Shape Analysis
Y. Hong, Y. Gao, M. Niethammer, and S. Bouix
Medical Image Computing and Computer-Assisted Intervention (MICCAI), 2014.
Statistical Testing for Longitudinal data
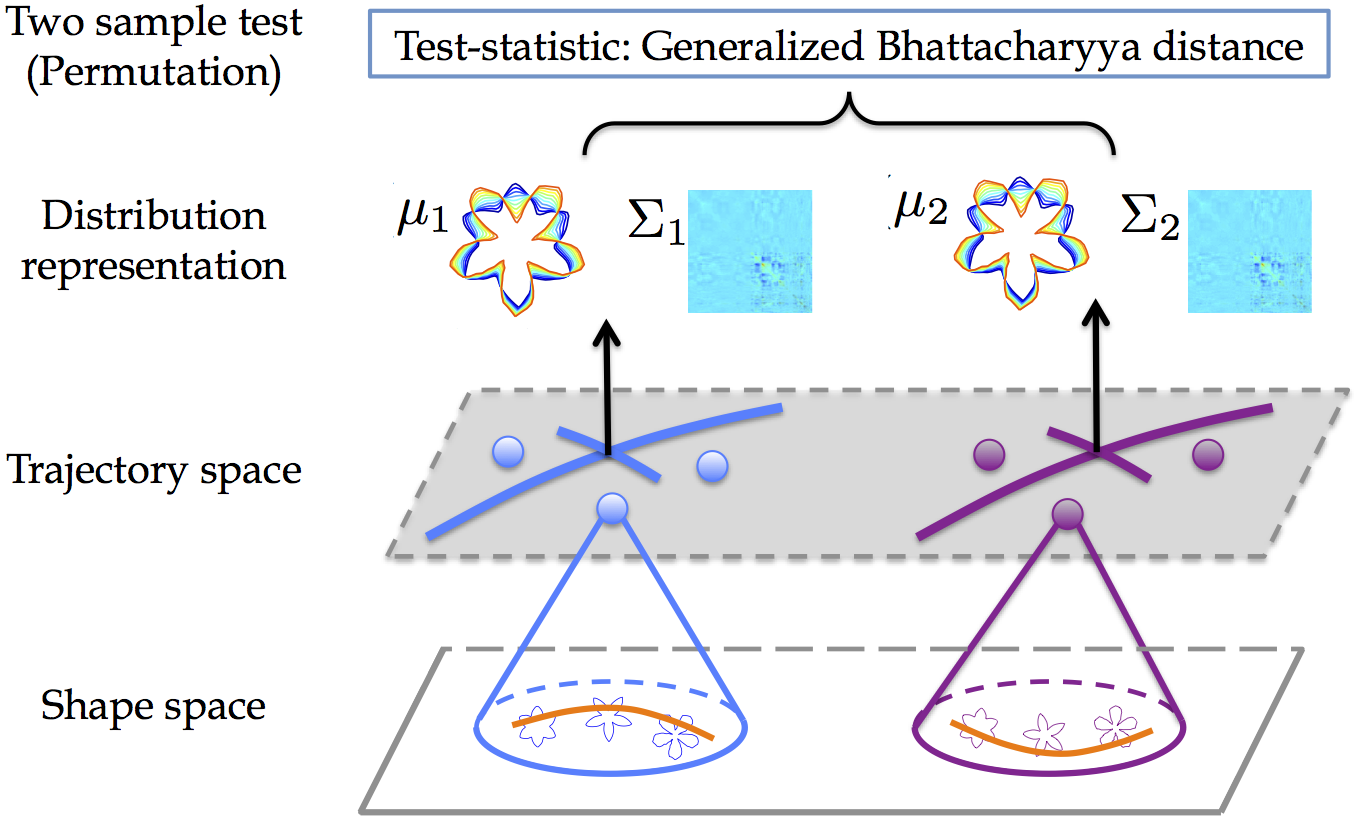 Longitudinal data designs frequently arise in medical research that involves repeated measurements during follow-up studies. For example, longitudinal studies in new-borns and young children use imaging at multiple follow-up visits to understand the process of early brain development. Recent methods for analyzing longitudinal, manifold-valued data allow for the estimation of trajectories, i.e., a smooth path estimated from the longitudinal data of subjects. Building upon these methods, approaches that compute averages of trajectories has been proposed; while they only capture limited information of the data distribution. Our goal is to develop an approach that leverages second-order statistics of shape trajectories for testing group differences. This higher-order description would be useful for a more comprehensive description of the underlying distributions. It would even benefit for designing test-statistics that go beyond a simple comparison of means, potentially resulting in strong statistical testing power.
In particular, we propose a generalization of principal geodesic analysis (PGA) to the tangent bundle of a shape space, where longitudinal data of a subject is represented as a point using initial conditions of a trajectory, and estimate both variance and principal directions of shape trajectories. We then introduce a generalization of the Bhattacharyya distance. It accounts for both mean and variance differences in trajectory distribution, which enables the assessment of statistical differences between groups of trajectories.
Group Testing for Longitudinal Data
Y. Hong, N. Singh, R. Kwitt, and M. Niethammer
International Conference on Information Processing in Medical Imaging (IPMI), 2015.
Statistical Atlas with Application to Upper Airway Obstruction
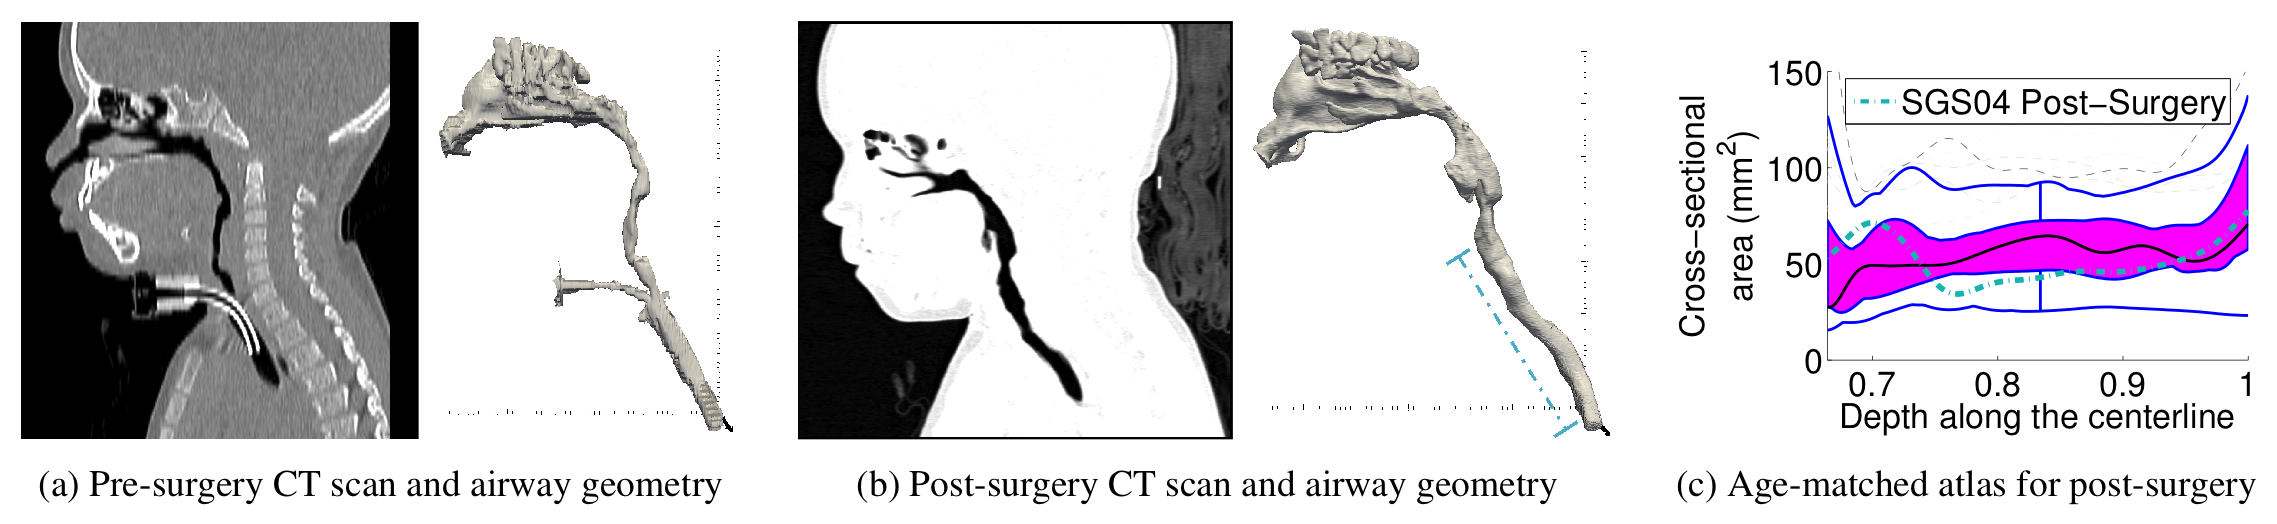 Abnormalities of the upper airway in infants and children may lead to life threatening respiratory difficulties, poor growth, delay in speech development and long term morbidity. Methods of evaluating and determining optimal management for upper
airway anomalies would be of tremendous benefit for improved clinical care and outcomes. To track and measure these anomalies, a pediatric airway atlas built from normal subjects is needed as a reference. Such an atlas would generally provide a domain for understanding airway growth patterns; it could also be customized to specific patients to capture airway stenoses. We propose a method to construct a pediatric airway atlas based on normal subjects. This method makes use of a simplified airway model and allows age-adapted atlas computations through kernel regression combined with the computation of statistical characterization of the population data using the weighted functional boxplot. This allows the generalization of concepts such as the median, percentiles, or outliers to spaces of data objects, not only functions, e.g., the pediatric airway application, but also shapes and images, e.g., corpos callosum shapes and its binary images.
Abnormalities of the upper airway in infants and children may lead to life threatening respiratory difficulties, poor growth, delay in speech development and long term morbidity. Methods of evaluating and determining optimal management for upper
airway anomalies would be of tremendous benefit for improved clinical care and outcomes. To track and measure these anomalies, a pediatric airway atlas built from normal subjects is needed as a reference. Such an atlas would generally provide a domain for understanding airway growth patterns; it could also be customized to specific patients to capture airway stenoses. We propose a method to construct a pediatric airway atlas based on normal subjects. This method makes use of a simplified airway model and allows age-adapted atlas computations through kernel regression combined with the computation of statistical characterization of the population data using the weighted functional boxplot. This allows the generalization of concepts such as the median, percentiles, or outliers to spaces of data objects, not only functions, e.g., the pediatric airway application, but also shapes and images, e.g., corpos callosum shapes and its binary images.
Statistical Atlas Construction via Weighted Functional Boxplot
Y. Hong, B. Davis, J.S. Marron, R. Kwitt, J. Kimbel, E. Pitkin, R. Superfine, S. Davis, C. Zdanski, and M. Niethammer
Medical Imaging Analysis (MedIA), 2014.Quantitative Assessment of the Upper Airway in Infants and Children with Subglottic Stenosis
C.J. Zdanski, S.D. Davis, Y. Hong, D. Miao, C. Quammen, S. Mitran, B. Davis, M. Niethammer, J.S. Kimbell, E. Pitkin, J. Fine, L. Fordham, B. Vaughn, and R. Superfine
The Laryngoscope, 2015.Weighted Functional Boxplot with Application to Statistical Atlas Construction
Y. Hong, B. Davis, J.S. Marron, R. Kwitt and M. Niethammer.
Medical Image Computing and Computer-Assisted Intervention (MICCAI), 2013.A Pediatric Airway Atlas and Its Application in Subglottic Stenosis
Y. Hong, M. Niethammer, J. Andruejol, J. Kimbel, E. Pitkin, R. Superfine, S. Davis, C. Zdanski, and B. Davis
International Symposium on Biomedical Imaging: from Nano to Macro (ISBI), 2013.
Physically-Based Fire Simulation
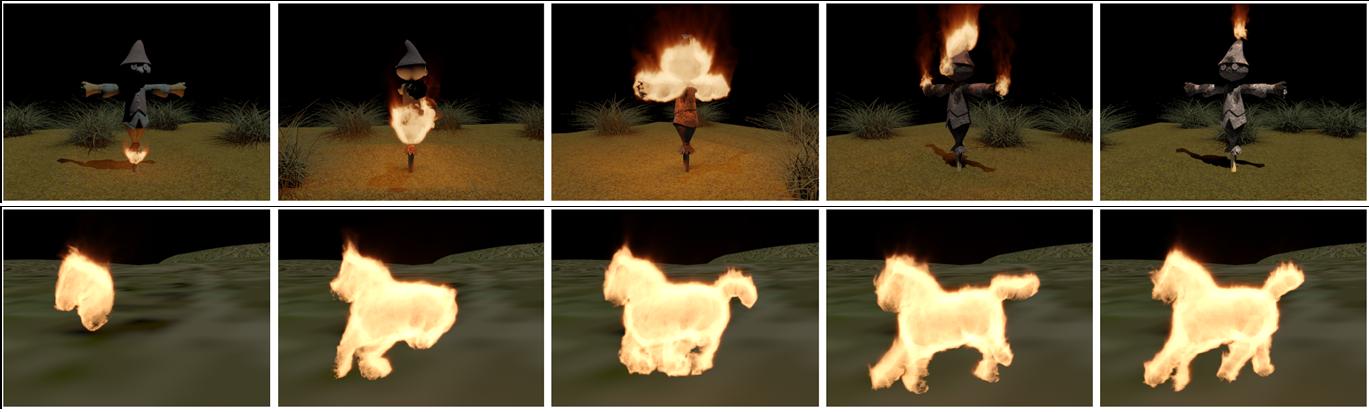 Natural phenomena simulation, e.g., fire, is commonly used in entertainment, video games, and fire prevention training. Physically-based modeling and animation allows to simulate real fire effect, while it has the challenge of controlling the behaviors of the simulated fire due to the non-linear properties of the underlying physical model. Our goal is to provide users the power of high-level control of fire while keeping the benefits from the physical model, resulting in a detail-free user interface to make desirable flame effects. The high-level control, for example, geometric constraints, e.g., mesh animation, and evolving rules, e.g., speed, are automatically converted and included in a control blue core (CBC), which is further leveraged by a defined L-Speed function and serves as the guidance of the large-scale motion of the fire. At the same time, the fire details are captured by the underlying physical model. To solve the model under the constraints of a sequence of evolving CBCs, we develop a modified closest-point model (MCPM) for dynamic constraints, since the original approach is limited to the statistic constraints.
Geometry-Based Control of Fire Simulation
Y. Hong, D. Zhu, X. Qiu, and Z. Wang
The Visual Computer (TVC), 2010. [Project]Generation of Fire Animation Based on Level-Set
Y. Hong, Z. Wang, D. Zhu, and X. Qiu
Journal of Computer Research and Development (JCRD, in Chinese), 2010. [Project]